

Improving insights into pharmaceutical claims with Tableau
Introduction:
A large insurance company was facing challenges in understanding and analyzing its pharmaceutical claims data. The data was stored in multiple systems, making it difficult to generate accurate and meaningful reports. The company realized that it needed a more effective solution to make data-driven decisions and better understand the trends and patterns in its pharmaceutical claims data.
Problem:
The insurance company faced several challenges in tracking and reporting on its pharmaceutical claims data, including:
- Inaccurate and inconsistent data: Data was stored in multiple systems, making it difficult to ensure the accuracy and consistency of the data.
- Time-consuming reporting process: Generating reports was a manual and time-consuming process that involved collating data from multiple sources.
- Limited data visualization: The existing reporting solutions lacked the ability to visualize data in meaningful and interactive ways, making it difficult for stakeholders to understand the data and make data-driven decisions.
Solution:
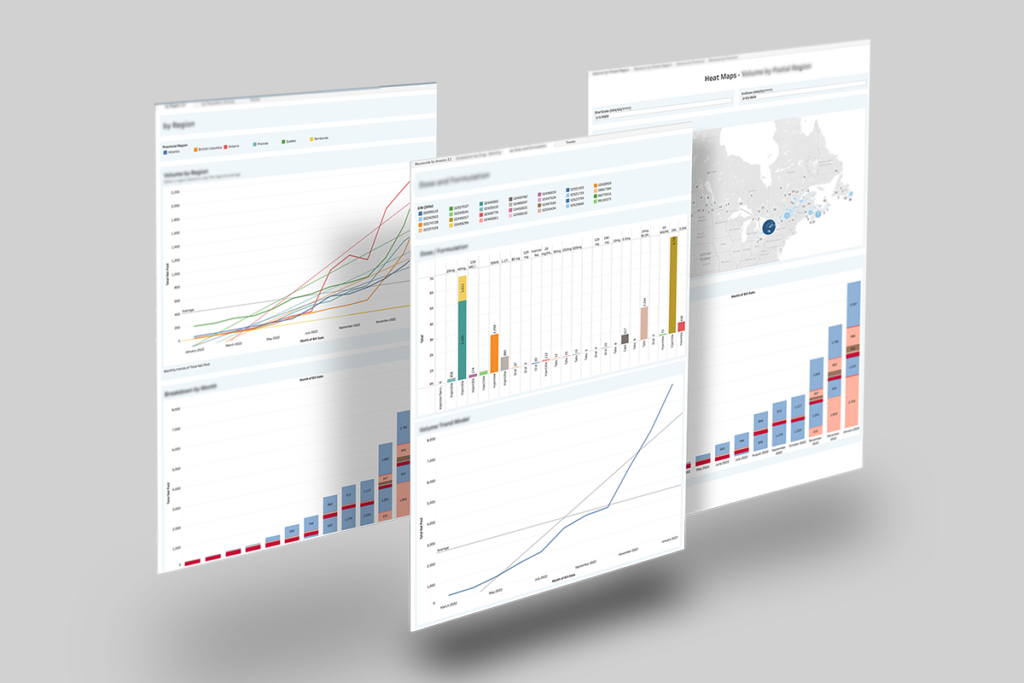
The insurance company decided to implement a reporting suite built on Tableau, a powerful data visualization and business intelligence tool. The reporting suite was designed to consolidate data from multiple sources and provide a centralized platform for tracking and analyzing pharmaceutical claims data.
Tableau was used to create a range of interactive dashboards and reports that provided real-time insights into the pharmaceutical claims data. The dashboards allowed stakeholders to see trends and patterns in the data, and the reports provided a comprehensive view of the company’s pharmaceutical claims.
Results:
The implementation of the Tableau reporting suite resulted in several positive outcomes for the insurance company, including:
- Accurate and consistent data: Data was consolidated from multiple sources, ensuring the accuracy and consistency of the data.
- Streamlined reporting process: The reporting process was streamlined, and reports were generated more quickly and efficiently.
- Enhanced data visualization: The Tableau dashboards and reports provided stakeholders with meaningful and interactive visualizations of the data, making it easier to understand and make data-driven decisions.
- Improved decision-making: The reporting suite provided stakeholders with real-time insights into the pharmaceutical claims data, allowing them to make more informed and data-driven decisions.
Conclusion:
The implementation of the Tableau reporting suite allowed the insurance company to streamline its reporting process and make data-driven decisions. The reporting suite provided stakeholders with accurate and consistent data, and the dashboards and reports provided meaningful and interactive visualizations of the data. The project was a success, and the insurance company plans to continue to use Tableau to track and analyze its pharmaceutical claims data.
Related items
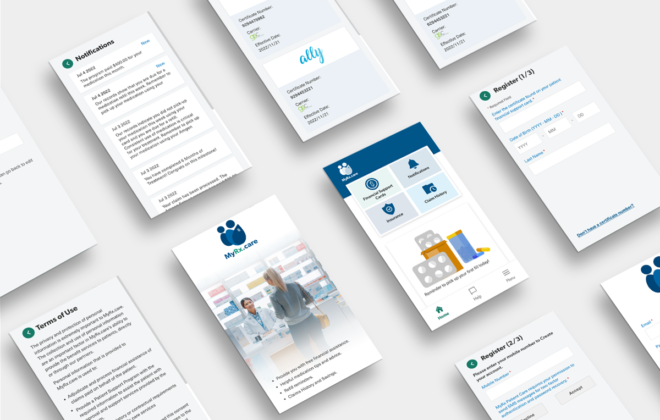
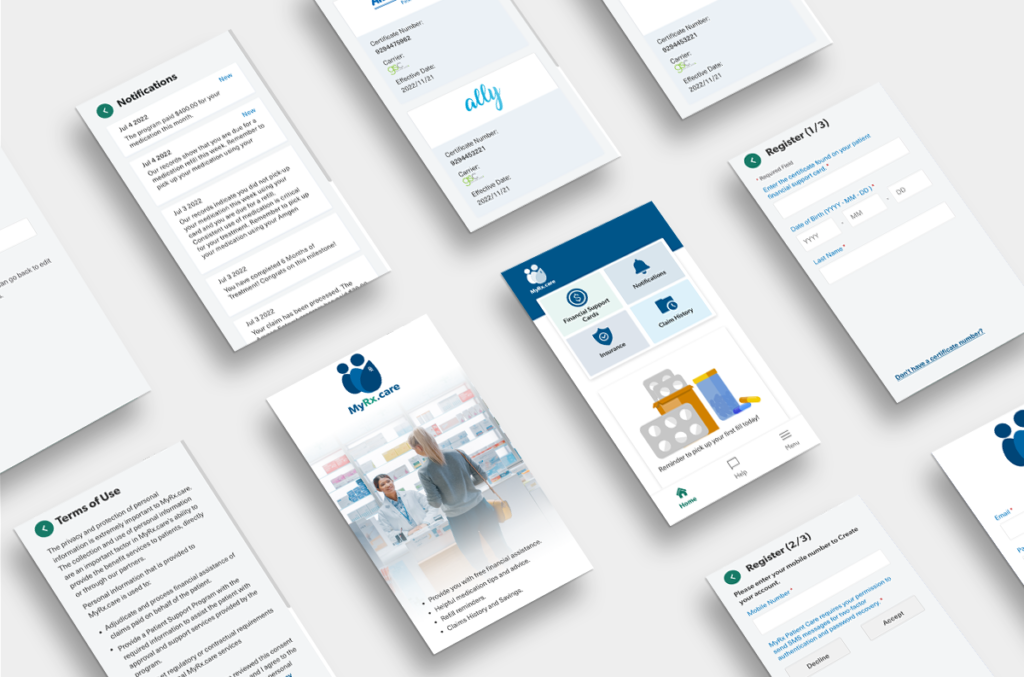
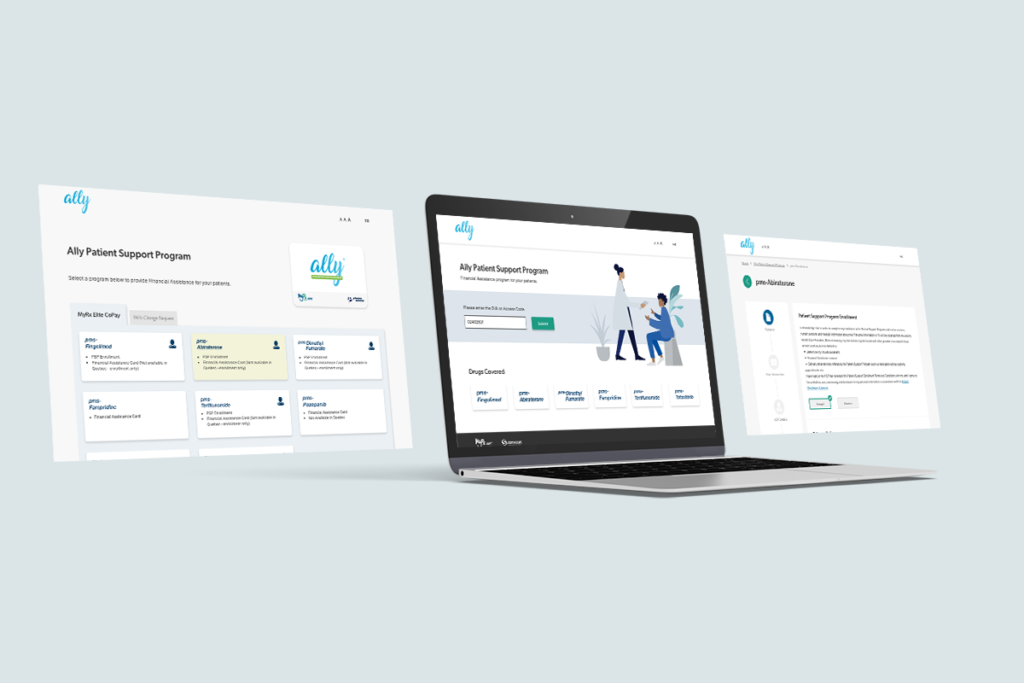
Improving patient adherence with a mobile app
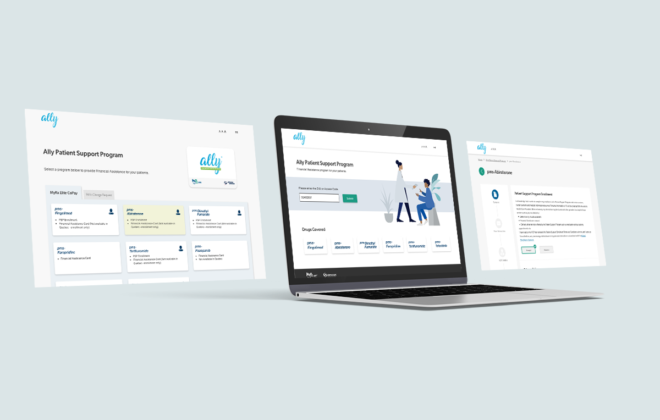
Improving patient engagement with a patient support program portal
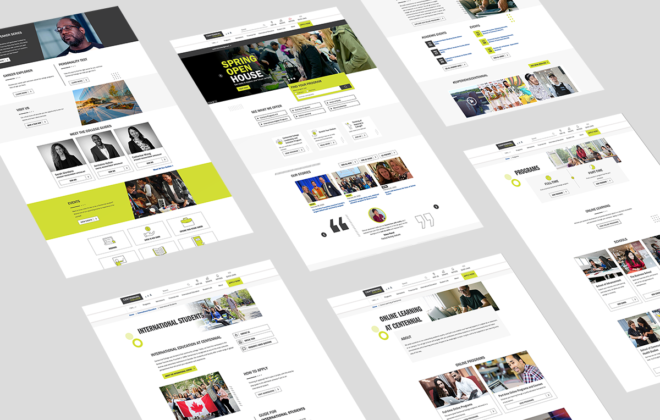
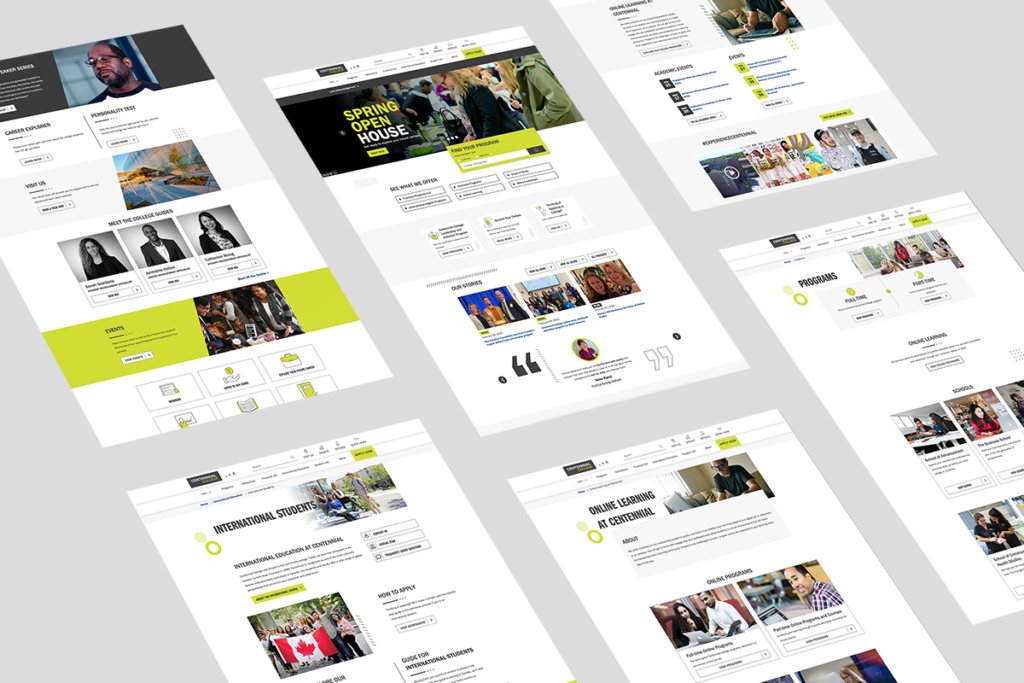
Centennial College website redesign and Umbraco CMS integration